
Learning how to track your website traffic is about way more than just counting visitors. It’s about getting inside the heads of the people behind the clicks so you can make smarter business decisions. The most common way to do this is with a web analytics tool, like Google Analytics, by installing a small piece of code on your site that starts collecting all sorts of valuable user data.
Why Website Traffic Insights Are Crucial for Growth
Before we get into the nuts and bolts of the setup, it's critical to understand why this stuff is a total game-changer.
Simply put, tracking your website traffic pulls you out of the world of guesswork and into data-driven strategy. It’s the difference between driving with a map versus driving with your eyes closed. Every single click, scroll, and visit tells a story about your audience.
This data is your direct line to understanding how people behave on your site. Are they finding you through Google searches? Social media? A link from another website? Knowing this tells you exactly which marketing channels are actually working and which ones are just wasting your time.
Uncover Your Audience’s Needs
Traffic analysis helps you build a crystal-clear picture of who your visitors are. You can find out where they live, what devices they're using, and—most importantly—what content they actually care about. This is the bedrock of any effective content strategy or product development plan.
Let's imagine you run an e-commerce store that sells handmade leather goods. Your analytics might show that a blog post titled "how to care for a leather wallet" is your single most-visited page, pulling in a ton of traffic from organic search.
This insight is pure gold. It tells you your audience isn't just there to buy something; they're actively looking for expert advice. That’s a massive signal to create more educational content, which is how you build trust and establish yourself as an authority.
Make Smarter Strategic Decisions
Once you're armed with real traffic data, you can start putting your resources where they'll make the biggest impact. If you see that your social media campaigns are driving tons of visitors but almost zero sales, you know it's time to adjust your approach. Maybe your messaging is off, or maybe that audience just isn't the right fit. Without the data, you’d just keep pouring time and money into a leaky bucket.
These insights touch every single part of your business growth. They help you:
- Refine Your Content Calendar: Create more of what your audience loves and ditch what they ignore.
- Optimize Marketing Spend: Double down on the channels that send you high-quality, engaged traffic.
- Improve User Experience: Pinpoint the exact pages where people are dropping off and fix what's broken to keep them around longer.
- Identify New Opportunities: Discover surprising traffic sources or content topics that could open up entirely new avenues for growth.
Ultimately, understanding how to track website traffic is the first real step toward building a growth engine that lasts. For more ideas on how to turn these insights into action, you can explore the various marketing strategies on the RebelGrowth blog.
Choosing the Right Analytics Tool for Your Goals
Picking the right analytics tool is your first real step toward effectively tracking your website's traffic. The market is flooded with options, but your decision shouldn't be about what's popular—it needs to be a perfect match for your business goals, how comfortable you are with tech, and your budget.
For a lot of people, the default starting point is Google Analytics 4 (GA4). It’s hard to argue with: it's free, incredibly powerful, and plugs right into the Google ecosystem, including Google Ads and Search Console. For anyone serious about tracking, understanding the power of Google Analytics is a game-changer. It gives you a mountain of data on how users behave, where they come from, and their journey to conversion.
That said, the sheer amount of data in GA4 can feel like drinking from a firehose, especially for beginners. Plus, the growing conversation around user privacy has opened the door for some fantastic, privacy-first alternatives.
Beyond the Googleverse: Privacy-First Analytics
Platforms like Plausible, Fathom, and Matomo have been gaining a lot of ground. They offer a pretty compelling trade-off: you get simpler, more focused dashboards and a solid commitment to not using cookies or collecting personal data. This makes them compliant with regulations like GDPR and CCPA right out of the box, without needing those complex consent banners.
These tools usually come with a subscription fee, but it's a small price to pay for building user trust and getting some peace of mind. If your brand is all about transparency and privacy, going with one of these tools sends a powerful message to your audience.
Making the Decision: Key Factors to Consider
So, how do you actually make a choice? It really just comes down to asking yourself a few key questions.
To help you decide, I've put together a quick comparison of some of the most popular tools out there. This table breaks down what each tool is best for, its standout feature, how it's priced, and its approach to privacy.
Comparison of Popular Website Analytics Tools
| Tool | Ideal For | Key Feature | Pricing Model | Privacy Focus |
|---|---|---|---|---|
| Google Analytics 4 | Businesses of all sizes needing deep, integrated analysis. | Event-based tracking and Google ecosystem integration. | Free | Moderate |
| Plausible | Privacy-conscious small to medium businesses. | Lightweight script and simple, clear dashboard. | Subscription-based | High (Cookie-free) |
| Fathom | Bloggers, freelancers, and privacy-focused sites. | Ultra-simple, one-page report. | Subscription-based | High (Cookie-free) |
| Matomo | Organizations needing full data ownership and customization. | Self-hosting option for 100% data control. | Freemium/Subscription | High (Configurable) |
This comparison should give you a good starting point. Think about your priorities: are you on a tight budget, or is user privacy your number one concern? Your answer will point you in the right direction.
For an even wider selection of tools to help grow your business, you can browse our comprehensive directory and find the perfect fit. - Check out our full list of recommended marketing solutions.
No matter which tool you pick, you'll be looking at some fundamental engagement metrics. The image below gives you a snapshot of what to aim for.
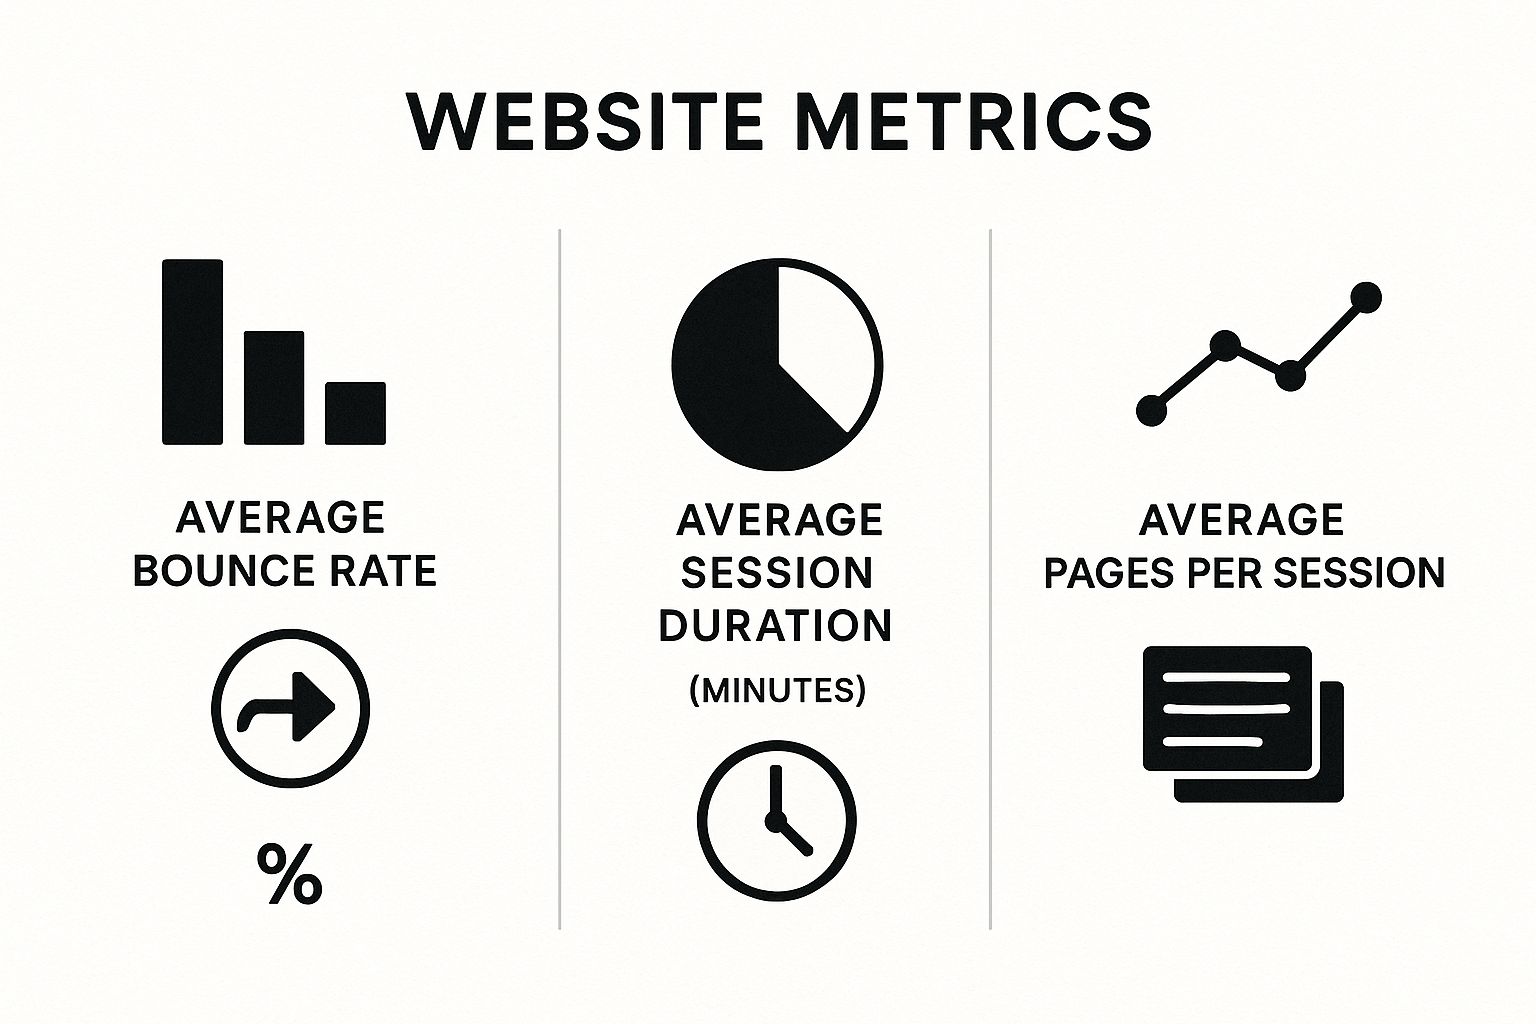
The data here is clear: a great site gets people to stick around longer and view more pages, which really drives home the importance of creating engaging content.
It's also worth noting the bigger picture. As of late 2023, Google's search engine commanded 87.65% of desktop web traffic, while Microsoft's Bing has grown to about 8.7%. For mobile, Google's hold is even stronger, at a staggering 95.48% of global traffic.
These numbers are important because any shift in search engine market share can directly impact where your traffic comes from.
Ultimately, the best tool is the one you’ll actually open up and use consistently. Pick the one that feels right for you, and you'll be on your way to making smarter, data-driven decisions.
Your Guide to Installing Analytics Tracking

This is where the rubber meets the road—turning the idea of data into something you can actually use. Getting your analytics tool installed is the bridge between guesswork and real, actionable insights.
For most people, this journey starts with Google Analytics 4 (GA4). It’s powerful, it's the industry standard, and it’s free. Your first move is to create your GA4 account and property. This process spits out a unique Measurement ID and a small piece of JavaScript code.
That little code snippet is the key. Think of it as a digital messenger. Once it’s on your website, it starts sending a stream of information back to your GA4 dashboard, lighting it up with data about your visitors. How you get that code onto your site really depends on what your website is built with and how comfortable you are poking around under the hood.
Choosing Your Installation Method
The good news? You have options, and you definitely don't need to be a developer to get this done. Most modern website builders have made this incredibly simple.
- WordPress Plugins: If your site is on WordPress, just use a plugin. Seriously. Tools like MonsterInsights or even Google's own Site Kit make this a breeze. They handle the installation for you; usually, all you have to do is log in to your Google account. No copying and pasting code required.
- CMS Integrations: Platforms like Shopify, Squarespace, and Wix have this down to a science. Dive into your site settings, and you'll find a dedicated spot for tracking codes, often labeled "Custom Code" or "Code Injection." Just paste your GA4 script there, and you're golden.
- Manual Installation: If you have a custom-built site or you just prefer doing things yourself, you can add the code manually. This means editing your website's theme or template files to paste the tracking script right before the closing
</head>tag. Make sure it goes on every single page.
Verifying and Troubleshooting Your Setup
Once the code is on your site, don't just walk away and assume it’s working. I've seen it a hundred times: a small installation error leads to weeks of bad or missing data. It's a painful mistake.
The quickest way to check your work is to use the Realtime report inside GA4. Open your website in a new browser tab, then watch the Realtime report. You should see your own visit pop up within a minute or two. If you do, you're in business.
Pro Tip: Not seeing any activity? The first thing to check is that you copied the entire script. A single missing bracket or quote will break it. Also, if you use a caching plugin (like on WordPress), clear the cache. It might be serving up an old version of your site without the new code.
And this goes beyond just basic traffic. If you're running paid campaigns, making sure things like Google Ads conversion tracking are firing correctly is absolutely critical. Taking a few minutes to verify everything now ensures you’re building your entire strategy on a foundation of solid, reliable data from day one.
Alright, you've got your analytics tool hooked up and humming along. The data is officially flowing. Now what?
Having a dashboard full of numbers is one thing; knowing what they actually mean for your website is a completely different ballgame. This is where we stop just collecting data and start translating it into a clear story about your visitors.
Think of your analytics dashboard as a live report on human behavior. Every single metric is a clue. Getting good at tracking website traffic means you're learning how to read these clues to understand what people love, what confuses them, and what ultimately makes them take action.
Understanding Users vs. Sessions
Right off the bat, you'll see two of the most fundamental metrics: Users and Sessions. It’s super common to mix them up, but the difference is critical.
- Users: This is the number of distinct individuals who visited your site. If one person comes to your site five times in a month, they’re still counted as just one user.
- Sessions: This is the total number of visits. In that same example, our one user generated five separate sessions.
So, what's a good sign? You want to see your number of sessions growing faster than your number of users. This is a huge win. It means people aren't just dropping by once; they're coming back for more. It's a strong signal that your content or products are hitting the mark.
To put this into perspective, the scale here is massive. As of mid-2025, Google.com alone was handling around 105 billion monthly visits from nearly 5.87 billion unique devices. That’s an insane amount of people looking for information. You can dive deeper into these trends with the full report on digital statistics from DataReportal.
This screenshot from Google Analytics shows a typical "Traffic acquisition" report, which is your go-to for seeing where people are coming from.

You can see "Direct" traffic is the biggest slice of the pie here, but check out "Organic Search." It's bringing in the most engaged users. That's a golden insight telling you that doubling down on SEO is probably a smart move.
Measuring What Matters Most
Counting visitors is just the start. The real magic happens when you understand what they do on your site. This is where engagement and conversion metrics steal the show.
The biggest shift I've seen in analytics is the move away from vanity metrics like raw pageviews. The focus now is on outcome-driven data. An "engaged session" is the new gold standard for quality traffic.
So, what is an engaged session? It’s a visit where the user did something meaningful. Maybe they stayed for longer than a set time (like 10 seconds), triggered a conversion event, or clicked through to a second page. Your Engagement Rate is simply the percentage of your total sessions that count as engaged. If that number is low, it’s a sign that your content might not be grabbing attention, or maybe your page is just loading too slowly.
Finally, we get to the big one: Conversions. This is the whole point, right? A conversion is any key action you want someone to take on your site. For example:
- Signing up for your newsletter
- Downloading a free guide
- Making a purchase
Tracking conversions is how you draw a straight line from your traffic to your business goals. A page with tons of visitors but zero conversions is waving a giant red flag. It signals a major disconnect between what people were expecting and what you're actually delivering.
By getting a handle on these core metrics, you move from being a passive observer of your traffic to an active strategist, shaping the user journey to get the results you want.
Analyzing Traffic Sources to Find Growth Opportunities
 Knowing how many visitors you get is interesting. Knowing where they come from? That’s powerful. This is the part of tracking website traffic where you stop just counting clicks and start finding real growth opportunities. It's all about dissecting your acquisition channels to figure out which marketing efforts are actually paying off.
Every analytics tool, from Google Analytics to Fathom, breaks down your traffic into a handful of key sources. The first step to making smarter decisions is simply understanding what each one represents. These channels tell a story about how people are finding you.
Decoding Your Main Traffic Channels
Think of these channels as different doors into your website. Each one attracts a distinct type of visitor, often with a unique intent.
- Organic Search: These are the people who find you through a search engine like Google. This traffic is often incredibly high-quality because users were actively looking for a solution you provide. Strong organic traffic is a great sign your SEO is working.
- Direct: This traffic comes from users typing your URL straight into their browser or using a bookmark. It's a huge indicator of brand recognition and customer loyalty. Plain and simple, people already know who you are.
- Referral: This is traffic from other websites that link back to you. Maybe someone clicked a link from a partner's blog, a directory, or a press mention. Referral traffic is fantastic for building authority and reaching totally new audiences.
- Social: This bucket includes visitors from platforms like Instagram, LinkedIn, or X (formerly Twitter). It’s a direct reflection of your social media marketing and how engaged your community is.
By seeing which channels bring in your most engaged visitors—those with a high engagement rate or the best conversion rate—you know exactly where to double down. If organic search is your top performer, that's a crystal-clear signal to invest more in your content and SEO strategy.
Turning Traffic Data into Actionable Strategy
Once you get a handle on where your visitors come from, the real work begins: analyzing their behavior. Don’t just look at which channel sends the most traffic; look at which one sends the best traffic.
For example, your social media might send thousands of visitors, but if they all bounce after three seconds, that traffic isn't very valuable. On the other hand, you might get just a handful of visitors from a niche referral link, but if they all sign up for your newsletter, that source is pure gold.
This is where you connect the dots between your marketing activities and actual business results. The goal isn't just more traffic; it's more of the right traffic—the kind that helps you hit your objectives.
You also have to consider the user experience for each source. Someone clicking from a search result for a "how-to guide" has totally different expectations than a person clicking a product link in a paid ad. Optimizing your high-converting landing pages for these different user journeys is crucial for turning visitors into customers.
This is especially true as user behavior continues to shift. The explosion in mobile usage has completely changed how people find and interact with websites. As of July 2025, mobile devices now account for a massive 64.35% of all global web traffic, a staggering increase from just 0.72% in 2009. This trend underscores the importance of a mobile-first approach in all your marketing channels. You can explore more data on this dramatic shift and what it means for businesses by reviewing the full research on mobile website traffic from Soax.
By regularly reviewing your traffic sources, you can spot trends, identify underperforming channels, and discover untapped opportunities, turning your analytics into a repeatable engine for growth.
Got Questions About Tracking Your Website Traffic?
Diving into website analytics for the first time can feel like learning a new language. A whole bunch of questions pop up, and that's totally normal. Let's walk through some of the most common ones I hear. Getting these sorted out is the first step to feeling confident in your data and actually using it to make smart decisions.
Why Do My Numbers Look Different in Different Tools?
This is a classic. You've got Google Analytics running, but maybe your hosting provider or another tool like Plausible is showing you something else. You're not going crazy, and your setup probably isn't broken.
The truth is, every analytics platform counts things a little differently. It's their secret sauce. They might have different rules for:
- Filtering out bots: Some are way more aggressive about ignoring non-human traffic than others.
- Defining a "session": How long does a user have to be inactive before their visit ends? This timeout period can vary, which changes your session count.
- Attributing traffic sources: The logic for deciding if a visitor is "Direct" versus "Organic Search" isn't universal.
My advice? Pick one tool to be your "source of truth." When you're making big strategic calls, stick to that single platform. It ensures you're always comparing apples to apples.
How Long Until I See Data?
Thankfully, you don't have to wait long. Once you get your tracking code installed correctly, you should start seeing data populate your main reports within 24 to 48 hours.
But you can check if it's working almost instantly. Most tools, including Google Analytics 4, have a Realtime report. Just open your website in another browser tab and keep an eye on that report. You should see your own visit show up within a minute or two. It's a great little confirmation that you're good to go.
Can I Track Traffic Without Google Analytics?
Absolutely. While Google Analytics is the 800-pound gorilla in the analytics world, it's far from your only choice. In fact, a lot of website owners are now turning to privacy-focused alternatives, and for good reason.
Tools like Fathom and Matomo are built from the ground up with user privacy in mind. They usually have simpler dashboards and can track visits without needing cookies. This makes them a fantastic option if you need to comply with regulations like GDPR and CCPA without plastering your site with complicated consent banners.
What Is the Difference Between a User and a Session?
Getting this one right is fundamental. It's the key to actually understanding what your reports are telling you.
Think of it this way:
A user is a unique person who visits your site. One individual.
A session is a period of that person's activity on your site.
So, if Sarah visits your blog on Monday and then comes back on Wednesday, your analytics will count that as one user and two sessions. A really healthy sign for your website is seeing your session count grow faster than your user count. It means people like what they see and are coming back for more.
Ready to stop guessing and start growing with data-driven insights? rebelgrowth gives you the tools to understand your audience, optimize your content, and turn traffic into results. Start your journey to smarter marketing today.