
So, what do we actually mean when we talk about content performance analysis?
At its core, it's the process of looking at your marketing metrics to figure out how people are really interacting with your content. More importantly, it connects those interactions back to your actual business goals. This isn't just about chasing page views. It's about tying your content efforts to tangible outcomes like leads, engagement, and ultimately, revenue.
Why Content Performance Analysis Is Non-Negotiable

Here's the hard truth: creating content without analyzing it is like setting sail without a rudder. Sure, you're moving, but you have absolutely no control over your direction. In a world where millions of blog posts go live every single day, just "hoping" for the best isn't a strategy.
Consistent content performance analysis is what separates the brands that achieve explosive growth from those that are just adding to the digital noise.
When you dig into the data, you stop guessing what your audience wants and start knowing. This data-driven mindset turns content from a line item on your budget into a predictable, revenue-generating engine. It’s how you justify your marketing spend, prove ROI, and make smarter decisions that actually move the needle.
From Creative Pursuit to Strategic Asset
The real work of a blog post, a social media update, or a new landing page begins the moment you hit "publish." Its job is to get people to take action, and analysis is the only way to know if it's actually succeeding. Without it, you’re flying blind. You can't tell the difference between a "hero" asset that's crushing your conversion goals and a "zero" that's just burning through resources.
The industry is all-in on this approach. A staggering 83% of marketers point to content marketing as their top method for generating demand. And they aren't just creating it; they're measuring it. In fact, 53% of marketers worldwide say that tracking social media and website engagement is their primary focus for gauging success. If you're curious, you can explore more content performance stats to see just how seriously businesses are taking this.
Simply put, content performance analysis bridges the gap between creation and results. It gives you the visibility needed to understand what’s working, what’s not, and where the biggest opportunities for growth are hiding.
Building Your Foundation for Growth
Getting started with analysis doesn't mean you need a massive, expensive tech stack right out of the gate. It really just starts with understanding the core pillars of what you should be measuring. Think of each pillar as telling a different part of your content's story—from how it gets discovered to its final impact on your bottom line.
To give you a clearer picture, I've broken down these fundamentals into a simple table. A solid grasp of these areas ensures you're not just collecting data, but gathering actionable intelligence. This is your roadmap for turning numbers into real improvement.
Core Pillars of Content Performance Analysis
| Pillar | What It Measures | Why It Matters |
|---|---|---|
| Audience Behavior | How users interact with your content (e.g., time on page, scroll depth). | Reveals if your content is genuinely engaging and valuable to your visitors. |
| SEO Visibility | Your content's ranking in search results and the organic traffic it generates. | Measures your ability to attract new, relevant audiences from search engines. |
| Lead Generation | The number of leads or sign-ups your content produces. | Connects content directly to list growth and your sales funnel. |
| Business Impact | The influence of content on conversions, customer acquisition, and revenue. | Proves the ultimate ROI and justifies continued investment in content marketing. |
By consistently keeping an eye on these areas, you create a powerful feedback loop. This loop is what allows you to refine your messaging, double down on what's resonating, and systematically improve your entire content operation. It’s not a one-and-done task; it’s the ongoing process that fuels sustainable growth.
Building Your Analysis and Measurement Framework
You can't do effective content analysis with a messy spreadsheet. It all starts with building a solid foundation first. And no, just installing Google Analytics doesn't count. You need to build a thoughtful measurement framework that actually tracks data tied to your business goals—not just generic traffic numbers.
Think of this framework as your single source of truth. It's the blueprint that makes sure the data from your website, CRM, and social media is clean, connected, and most importantly, something you can actually use. Skip this step, and you’ll find yourself drowning in numbers but starving for real insights.
Defining Your Core Business Objectives
Before you track a single click, you have to know what success even looks like. What are you actually trying to achieve?
Are you trying to generate qualified leads for your sales team? Is the main goal to build brand authority and fill the top of your funnel? Or are you focused on keeping existing customers happy with educational content?
Your answer changes everything. A company that needs leads will care deeply about form submissions and new contacts. But a business focused on brand authority? They'll be watching metrics like organic search visibility and time on page.
The goal isn't to track everything; it's to track the right things. A well-defined objective keeps you from chasing vanity metrics that do nothing for your bottom line.
Here’s a real-world example: A SaaS company might set a goal to "Increase free trial sign-ups from blog content by 20% this quarter." That single, specific goal immediately tells you what to measure: conversions on trial sign-up forms that came directly from blog posts. Simple.
Configuring Goals and Custom Events
With your objectives locked in, it's time to tell your analytics tools what to watch for. This is where you go way beyond basic page views and start tracking actions that prove people are interested. This means setting up custom goals and events.
Walk through the user journey on your site. What are the key moments you need to capture?
- Newsletter Sign-ups: Set up an event that fires every time someone successfully subscribes.
- Demo Requests: This is a big one. Track every submission of your "Request a Demo" form as a primary conversion.
- Resource Downloads: Create an event to count how many visitors grab your whitepapers or case studies.
- Video Engagement: Don't just track video plays. Measure how many people watch more than 75% of a video—that shows real interest.
When you set these up, your content performance analysis gets tied directly to user behavior that signals intent. You’re no longer just counting traffic; you’re measuring engagement that actually moves the needle. For more on how to grow your business with content, the Rebel Growth blog has some fantastic strategies.
This flow chart gives you a simplified look at how different data points get collected, processed, and then visualized in a typical measurement setup.
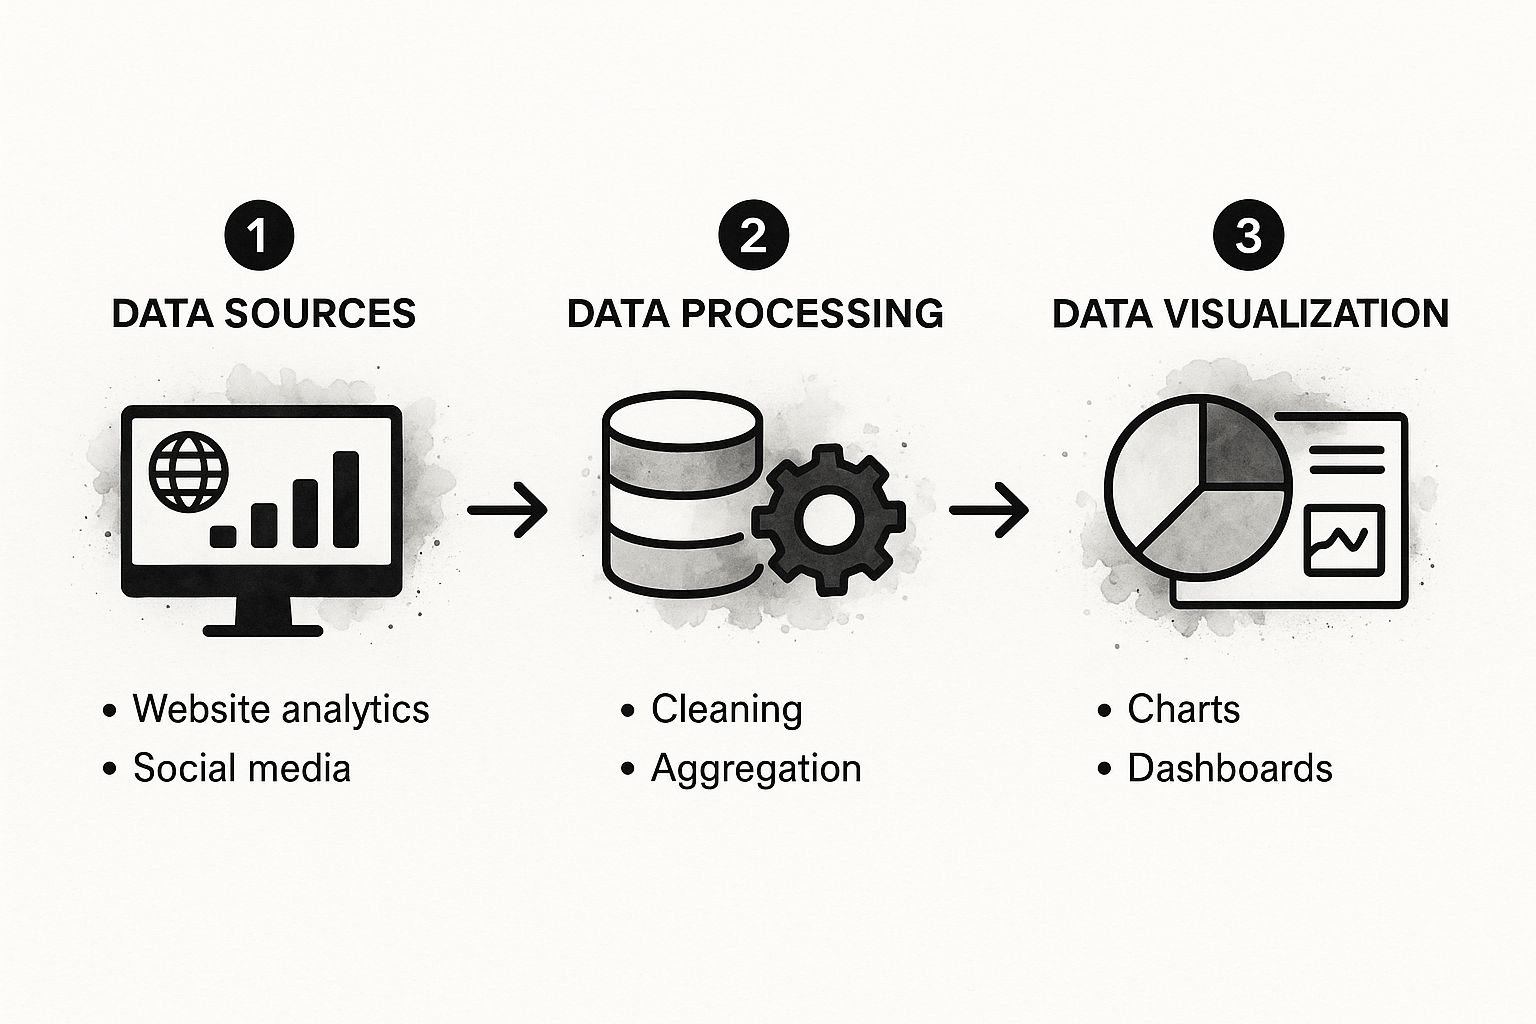
The main takeaway here is pretty clear: raw data from analytics and social media is just noise until you clean it up, aggregate it, and present it in a way that makes insights jump out at you.
Unifying Your Data Sources
To get the full story of your content's performance, you have to look beyond just your website. A good framework pulls in data from multiple platforms to show you the complete user journey. If your data is stuck in silos, you're flying blind.
Consider this common scenario: a user sees your brand on a LinkedIn post, clicks through to read a blog article, and then finally converts a week later from an email campaign. A unified framework connects those dots, showing you exactly how your channels work together.
Here's how to pull it off:
- UTM Parameters: Get religious about using UTM tags on all your campaigns—social, email, paid ads, you name it. This is how you accurately attribute traffic sources in your analytics.
- CRM Integration: This is a game-changer. Connect your analytics to your CRM (like HubSpot or Salesforce). Now you can link website activity directly to lead and customer data, letting you see which content pieces bring in your most valuable customers.
- Data Dashboards: Use a tool like Google Looker Studio or Tableau to pull all your data sources into one place. This gives you a bird's-eye view of all your KPIs, making reporting and analysis way faster.
Once you build this connected ecosystem, you're no longer staring at a bunch of disjointed metrics. You're reading a clear story about your content's real-world impact.
It’s all too easy to drown in a sea of numbers. Page views, likes, shares—these are often called vanity metrics. Why? Because they look impressive on a report but don’t actually tell you if you're hitting your business goals. A proper content performance analysis cuts through that noise to focus on what really drives growth.
The trick is to sort your metrics into buckets that mirror the customer journey, from that first "hello" all the way to conversion. This way, you’re not just looking at a single, isolated chapter; you're reading the whole story of how your content is working for you.

Audience Behavior: The First Signal of Engagement
This is where you find out if people actually like what you’re putting out there. It's the rawest, most honest feedback you can get. Sure, high traffic is nice, but if visitors bounce the second they arrive, that traffic is basically worthless.
You need to look past simple page views and dig into what people do after they land on your page. These are the metrics that show if you're truly connecting with them.
- Time Per Page View: This is a big one. It shows how long people are sticking around. A longer duration usually means they’re hooked, reading your content, and finding real value in it.
- Scroll Depth: This tells you how far down the page people are getting. If you can get a visitor to scroll 75% or more of the way down, that's a massive win and a strong sign of high engagement.
- Average Bounce Rate: Now, a high bounce rate can be alarming, but context is everything. For a blog post that perfectly answers a specific question, a user might find their answer and leave—that's a high bounce rate, but it's okay. For a critical service page, though? It’s a major red flag.
Think of these behavioral metrics as your early-warning system. They help you spot issues long before they start cratering your bigger goals, like lead generation.
Don't mistake traffic for engagement. A blog post with 1,000 views and a 3-minute average time on page is far more valuable than a post with 10,000 views and a 15-second average time. One builds an audience; the other just gets clicks.
SEO Visibility: Attracting the Right Audience
You can’t analyze content that nobody can find. SEO metrics are the foundation here. They measure your ability to pull in organic traffic from search engines—which is often the most valuable source of new, interested visitors you can get.
The goal is to see how well your content is ranking for the keywords that matter to your business. This is how you consistently fill the top of your funnel with a stream of relevant prospects. A key part of this involves understanding the right social media performance metrics, as they often feed into your overall visibility strategy.
To really nail this, it helps to map your metrics to where your audience is in their journey.
Essential Content Metrics by Funnel Stage
| Funnel Stage | Primary Goal | Key Metrics to Track |
|---|---|---|
| Top of Funnel (ToFu) | Awareness & Discovery | Organic traffic, keyword rankings, social shares, new vs. returning users |
| Middle of Funnel (MoFu) | Engagement & Consideration | Time on page, scroll depth, newsletter sign-ups, asset downloads |
| Bottom of Funnel (BoFu) | Conversion & Decision | Conversion rate, MQLs, CAC from content, demo requests, sales |
This table gives you a clear roadmap. You can see at a glance which numbers to watch based on what you’re trying to achieve at each stage, from grabbing initial attention to closing the deal.
Business Impact: The Ultimate Proof of ROI
At the end of the day, your content needs to drive business results. This is where your content performance analysis connects the dots directly to your bottom line and proves its worth. These are the numbers that get the C-suite's attention.
The impact of content on lead generation is huge. Studies have found that 76% of marketers say their content successfully generates leads, and 63% confirm it helps build customer loyalty. Those are powerful outcomes that more than justify the investment.
Here’s how you measure that real-world impact:
- Marketing Qualified Leads (MQLs) from Content: Forget raw form submissions. How many leads coming from your content are actually good enough to hand off to the sales team? This is a much more powerful indicator of quality.
- Conversion Rate on Landing Pages: When this number is high, it's a crystal-clear sign that your message and your offer are perfectly in sync. We've put together a guide on how to create high-converting landing pages if you want to dig deeper.
- Customer Acquisition Cost (CAC) via Content: This one is simple but critical. How much does it cost to get a new customer through your content marketing? A low CAC is the holy grail of sustainable, profitable growth.
Tracking these business-focused KPIs ensures your content strategy isn't just a creative side project—it’s a core engine driving your company’s success. It shifts the conversation from, "How many people saw our post?" to, "How much revenue did our content generate this quarter?"
How to Find the Story in Your Content Data
Collecting data is the easy part. Honestly, any analytics tool can spit out numbers at you all day long.
The real skill—the one that separates the pros from everyone else—is finding the story hidden inside all that data. This is where you stop just looking at the what and start truly understanding the why.
Think of it this way: your numbers are trying to tell you something. A high bounce rate isn't just a percentage; it's a signal. A low conversion rate isn't just a failure; it's an open question. A solid content performance analysis is your decoder ring, helping you figure out what these signals mean and how to act on them.
Segmenting Data to Uncover Hidden Truths
Looking at your data in one big lump is like trying to read a book after you’ve ripped out all the pages and thrown them on the floor. You’ll see the words, but the plot will be completely lost. To find the real narrative, you have to segment your data to see how different groups of people interact with your content.
Let’s say you have a key pillar page with a shockingly high exit rate. Your first instinct might be to panic, thinking the page is a total flop. But hold on. By segmenting your traffic, you might uncover a completely different story.
- Traffic Source: You could discover that visitors from organic search have a low exit rate and spend several minutes on the page. But the traffic from a new social media campaign? They’re bouncing almost immediately. This tells you the page itself is solid; the problem is a mismatch between your social ad and what the page actually delivers.
- Device Type: Maybe you find that desktop users are converting just fine, but mobile users are leaving in droves. This points straight to a crummy mobile user experience. Perhaps a form is a nightmare to fill out on a phone, or the text is just too small to read.
- User Persona: If you’ve set up user personas, segmenting by their behavior can be a goldmine. You might find your "Advanced Practitioner" persona eats up all the technical details, while the "Curious Beginner" persona gets overwhelmed and hits the back button.
Segmentation transforms a vague problem like a "high exit rate" into a specific, actionable insight like, "Our Facebook ad is sending the wrong audience to this page, so we need to change the ad copy."
Conducting Audits to Find Your Heroes and Zeros
Here’s a hard truth: not all of your content is created equal. A content audit is simply the process of systematically reviewing everything you’ve published to see what’s working and what’s not. It helps you pinpoint your "hero" content—the top-performing pieces that drive the most results—and your "zero" content, which is just taking up server space.
A simple way to get started is to plot your content on a basic 2x2 matrix:
| High Traffic | Low Traffic | |
|---|---|---|
| High Conversion | Hero Content: These are your superstars. Promote and protect them. | Hidden Gems: These pieces are effective but need a traffic boost. |
| Low Conversion | Leaky Buckets: They get visitors but don’t convert. Optimize these. | Zeros: These are dead weight. It’s time to either prune or completely revamp. |
This isn't just an excuse to delete old posts. It’s a strategic move to focus your time, money, and energy where they’ll make the biggest difference. To add another layer, doing a thorough competitor analysis for marketing can show you what’s working for others and reveal gaps you can fill.
Your best content often follows a power-law distribution. This means a tiny percentage of your articles will likely generate a huge percentage of your results. Your job is to find that golden sliver and amplify it.
Using Cohort Analysis for Long-Term Insights
While most metrics give you a snapshot in time, cohort analysis is like a time-lapse video. It shows you how user behavior changes over weeks and months. A cohort is simply a group of users who share a common trait, like signing up in the same week or visiting your site for the first time from the same ad campaign.
For instance, you could create two distinct cohorts:
- Cohort A: Users who read your "Ultimate Guide to X" within their first week.
- Cohort B: Users who didn't read that guide.
By tracking these two groups over several months, you can answer some seriously powerful questions. Does Cohort A end up having a higher customer lifetime value? Do they log into your product more often? This type of analysis directly connects a specific piece of content to long-term business goals, proving its impact far beyond the initial page views.
This is how you turn your content performance analysis from a reactive reporting task into a strategic tool. It helps you not only understand but also predict customer behavior. And that’s how you prove that great content doesn’t just generate a lead; it creates a better, more loyal customer.
Using AI for Smarter Content Analysis

Let's be real. Artificial intelligence isn't just some buzzword anymore. It's become a seriously powerful tool for any marketer who wants to get a real handle on their content performance analysis.
AI tools can tear through massive amounts of data in minutes, finding deep insights that would take a human analyst weeks to even scratch the surface of. This means you can make decisions faster and, frankly, smarter—backed by more than just gut feelings.
And the shift is happening right now. A whopping 77.9% of marketers are using generative AI for things like brainstorming and outlining, which directly feeds into creating better-performing content. The proof is in the results: only 21.5% of marketers using AI report their strategies are underperforming, compared to a much higher 36.2% for those not using it. You can explore the full report on AI in marketing for all the details.
Essentially, AI doesn't replace you; it just makes your analysis sharper and more predictive.
Pinpoint Content Gaps and Nail User Intent
One of the best things about using AI is its uncanny ability to figure out user intent at a massive scale. These tools can sift through thousands of search queries, social media comments, and even customer support tickets to spot common themes and questions you haven't answered.
This is how you uncover those "Aha!" content gaps you would have completely missed otherwise.
For example, an AI platform might chew through your blog's search data and notice that while you have a ton of content on "lead generation," people are constantly searching for "lead generation for small businesses." That specific insight is gold. It lets you create a hyper-targeted article that speaks directly to a hungry audience, boosting both your engagement and your conversion rates.
AI doesn't just show you what topics are popular. It reveals the exact language and pain points your audience uses, helping you create content that hits home.
Get Ahead with Predictive Analytics and Smart Recommendations
AI is doing more than just finding what's missing; it's starting to predict the future. Modern platforms can actually forecast a piece of content's potential success before you even hit publish. By crunching your historical performance data against current market trends, these tools can give you a solid prediction of traffic, engagement, and even conversion potential.
This totally changes how you plan content. Instead of just relying on intuition, you can get data-backed recommendations on things like:
- Winning Headlines: AI can generate and test dozens of headline variations to predict which one will get the best click-through rate.
- Topic Ideas: It can spot trending topics in your niche that have huge organic traffic potential but aren't saturated with competition yet.
- Content Structure: Some tools can even suggest the ideal layout for an article to keep readers hooked and maximize on-page time.
When you're ready to put this into practice, tools like an AI web scraper can be a huge help. They automate the grunt work of data collection, feeding the raw information into your analysis tools.
This frees up your team to do what they do best: focus on strategy and creativity instead of getting bogged down in manual data entry. At the end of the day, using AI for your content performance analysis gives you a massive competitive advantage, turning your data into a proactive engine for growth.
All that analysis is great, but it's completely useless if it just sits in a spreadsheet. The whole point of digging into your content performance is to walk away with a clear, concrete plan for what to do next. This is where you turn all those charts and numbers into a tangible roadmap that actually improves your content ROI.
This isn't about creating some massive, overwhelming to-do list. It’s about being strategic. Your roadmap should spell out what to update, what to create, and—just as important—what to kill off. It’s the final, critical step that connects your hard work to real business growth.
The Prioritization Framework
Your data will probably spit out dozens of things you could do. But you can't tackle them all at once. I’ve found that a simple Impact vs. Effort matrix is one of the most effective ways to prioritize. It forces you to focus on the quick wins and high-leverage activities first, pushing the resource-draining projects to a more strategic time.
Here's how to think about it. Just categorize your potential actions:
- High Impact, Low Effort: These are your absolute top priorities. Think about simple fixes like updating the call-to-action on a high-traffic blog post or refreshing an old article with new, relevant statistics. These are the low-hanging fruit.
- High Impact, High Effort: These are the big, meaty projects, like a total rewrite of a core pillar page or launching a new video series. You'll want to schedule these carefully and make sure you have the resources lined up.
- Low Impact, Low Effort: These are small, "nice-to-have" tweaks. Knock them out when you have some downtime, but don't let them derail you from the bigger-picture goals.
- Low Impact, High Effort: Just avoid these. They're resource vampires that suck up time and budget with very little to show for it.
Using a framework like this stops you from getting bogged down in minor edits and keeps your team laser-focused on the changes that will actually move the needle.
A common mistake is treating every insight as equally urgent. A proper roadmap isn't just a list; it's a strategic sequence of actions designed to deliver the maximum return on your team's time.
Tactics for High-Potential Content Refreshing
Your content audit probably uncovered a few "leaky buckets"—articles that get tons of traffic but have terrible conversion rates—or some "hidden gems" that convert really well but nobody can find. These are your prime candidates for a refresh.
Instead of starting from a blank page, you're building on an existing foundation. In my experience, this approach delivers results much faster than creating brand-new content from scratch.
Real-World Scenario: Let's say your analysis shows a blog post on "social media marketing tips" pulls in 10,000 monthly views but has a cringe-worthy 85% bounce rate and generates zero leads. The traffic proves people are interested, but the content itself is failing them.
Your action plan could look something like this:
- Update Outdated Information: The post is from two years ago. It's ancient. Refresh it with current data, yank any advice about platforms that are no longer relevant, and add new, modern trends.
- Improve On-Page SEO: The current title is just "Social Media Marketing Tips." It's generic. Optimize it to something like "15 Actionable Social Media Marketing Tips for 2024" and weave in more specific, long-tail keywords people are actually searching for.
- Enhance the CTA: The call-to-action is a weak "Contact Us." No one's clicking that. Swap it out with a valuable content upgrade, like a downloadable "Social Media Content Calendar Template," to actually capture those leads.
These targeted changes directly address the weak spots your data pointed out, effectively plugging the holes in that leaky bucket and turning it into a high-performing asset.
Repurposing Your Winners for Maximum Reach
Your best content—the stuff that already drives serious traffic and conversions—shouldn't just be collecting dust. The smartest play is to repurpose these proven winners into different formats to hit new audiences on entirely new platforms.
Repurposing extends the life and value of your best work, squeezing every last drop of ROI from your initial time and effort. It's the classic "work smarter, not harder" mantra in action.
- A top-performing blog post can become an engaging infographic perfect for sharing on Pinterest and LinkedIn.
- Key insights from a detailed case study can be chopped up into a short, punchy video for Instagram Reels or YouTube Shorts.
- A popular webinar can be broken down into a multi-part email series that nurtures your newsletter subscribers.
This strategy gets your message in front of more people without forcing you to reinvent the wheel every single time. If you need some ideas for tools or agencies that specialize in this kind of work, browsing a curated business list like the Rebel Growth directory can point you to some excellent options.
Creating New Content with Confidence
Finally, your content performance analysis should become the number one driver for your future content calendar. The data tells you exactly what resonates with your audience, what questions they're asking, and which topics are actually driving conversions.
Use these insights to build a content plan based on hard evidence, not guesswork. If your analysis shows that all of your case studies have sky-high engagement and lead to demo requests, the decision is easy: make more case studies. If "how-to" guides for beginners consistently crush your advanced technical articles, you know where to focus your energy. This data-backed approach means every new piece of content you create has the highest possible chance of success from the get-go.
Ready to stop guessing and start growing? Rebel Growth provides an all-in-one solution with AI-powered content creation, backlink networking, and automated social media management. Turn your insights into action and see measurable results. Explore how Rebel Growth can transform your marketing today.